
Categories
Home Buying, Housing Market Trends, first time home buyer, home buyer massachusettsPublished October 2, 2026
How to Lower Your Mortgage Payment: Rate Buydowns Explained for Massachusetts Buyers

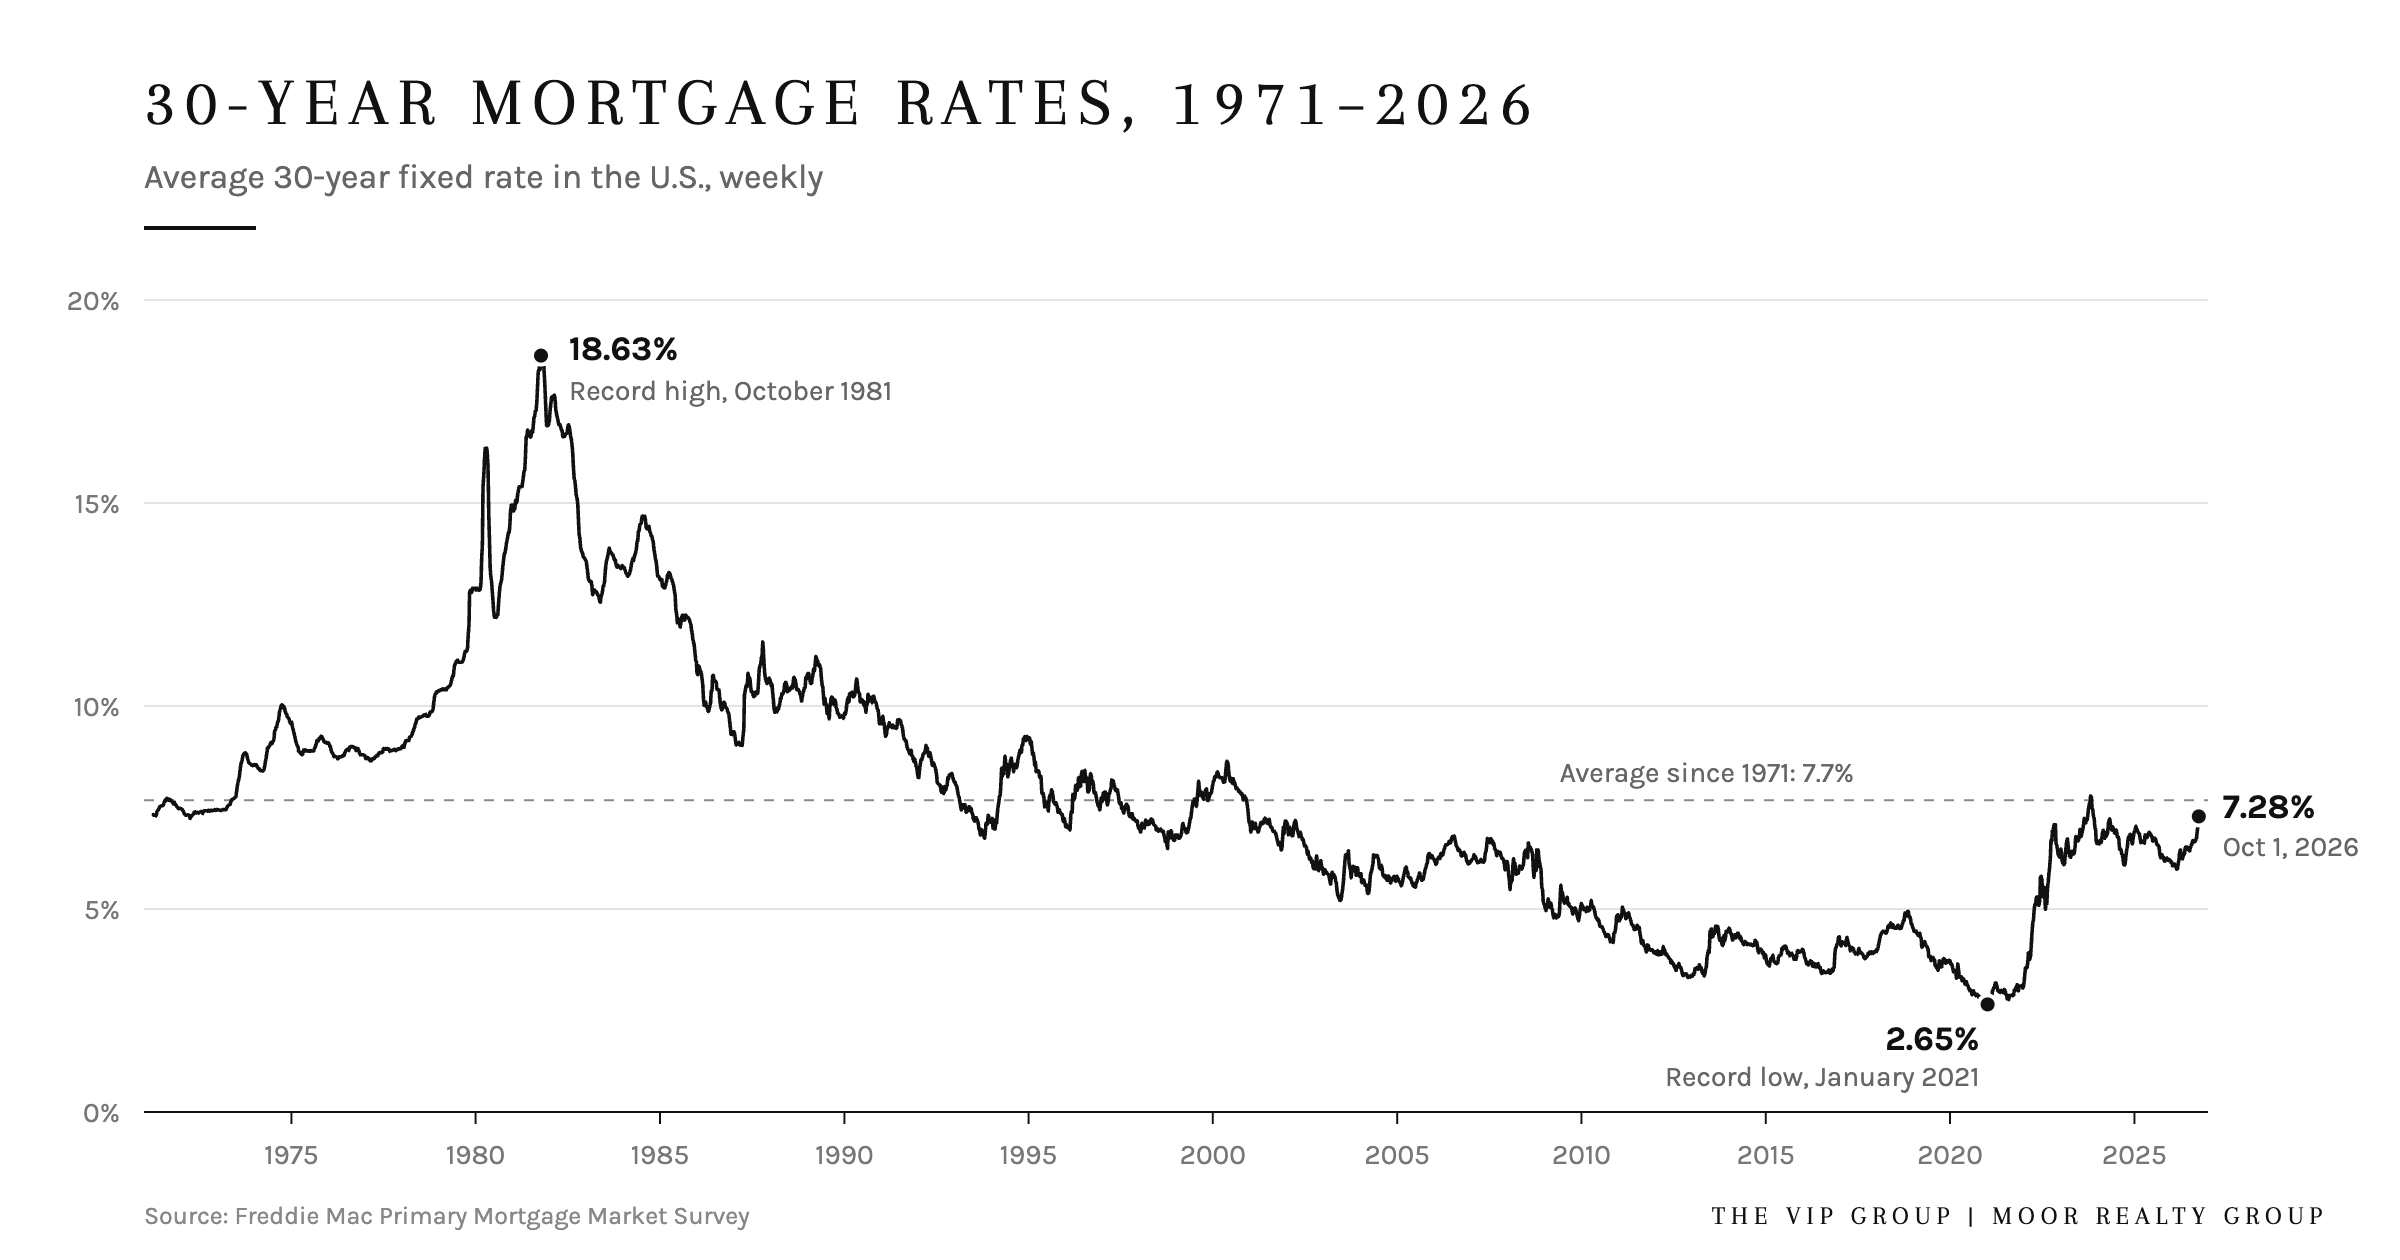
Quick Answer: The average 30 year fixed mortgage rate was 7.03% the week of September 24, 2026. That's the highest reading in the past year, but it's below the long run average of about 7.7% since 1971, and far below the record high of 18.63% in 1981. A rate buydown lowers your interest rate by paying the lender money up front. A temporary buydown (like a 2-1) cuts your rate for the first year or two. Discount points lower it for the life of the loan. Sellers can often pay for a buydown as a concession. Meanwhile, Massachusetts home prices have more than doubled since 2012, when the statewide median single family price was $290,000. In 2025 it was $638,000.
Key Takeaways
- Today's rates feel high compared with 2020–2021, but they're close to the historical norm.
- A 2-1 buydown can lower your payment by hundreds of dollars a month for the first two years.
- Sellers can pay for buydowns as a concession, within limits set by your loan program.
- Discount points usually take about 5 years to pay for themselves in savings.
- Over the long term, Massachusetts homes have built significant equity. The FHFA index shows prices up about 383% since 1991.
What Are Mortgage Rates Today?
According to Freddie Mac's Primary Mortgage Market Survey for the week of September 24, 2026:
- 30-year fixed: 7.03%, up from 6.95% the week before and 6.30% a year ago.
- 15-year fixed: 6.42%, up from 6.26% the week before and 5.49% a year ago.
Over the past 52 weeks, the 30 year rate has ranged from a low of 5.98% (February 26, 2026) to this week's high of 7.03%. So far in 2026, it has averaged 6.41%.
How Do Today's Rates Compare to History?
|
Year |
Avg. 30-Year Fixed Rate |
|
1972 |
7.38% |
|
1981 (record year) |
16.64% |
|
1990 |
10.13% |
|
2000 |
8.05% |
|
2008 |
6.03% |
|
2012 |
3.66% |
|
2019 |
3.94% |
|
2021 (record low year) |
2.96% |
|
2023 |
6.81% |
|
2024 |
6.72% |
|
2025 |
6.60% |
|
2026 (through September 24) |
6.41% |
- Record high: 18.63%, the week of October 9, 1981.
- Record low: 2.65%, the week of January 7, 2021.
- Long-run average: about 7.7%, based on every weekly Freddie Mac reading since April 1971.
The takeaway: the ultra-low rates of 2020–2021 were the exception, not the norm.
How Much Does the Rate Change Your Monthly Payment?
Here's the monthly principal and interest on a $630,000 loan (a $700,000 home with 10% down) at different historical rates:
|
Rate |
Monthly Principal & Interest |
|
2.96% (2021 average) |
$2,643 |
|
3.94% (2019 average) |
$2,986 |
|
6.60% (2025 average) |
$4,024 |
|
7.03% (today) |
$4,204 |
|
7.68% (long-run average) |
$4,483 |
30-year fixed. Doesn't include taxes, insurance or PMI. For illustration only.
The difference between 2021 and today is about $1,560 a month. That gap is why rate buydowns have become one of the most popular tools in real estate.
What Is a Mortgage Rate Buydown?
A rate buydown means paying money up front, at closing, to get a lower interest rate on your mortgage. The buyer, the seller, a builder or the lender can pay for it. There are two main types:
1. Temporary Buydowns (2-1, 3-2-1, 1-0)
A temporary buydown lowers your rate for the first few years, and then it goes back to the full note rate. For example, with a 2-1 buydown on a 7% loan, your rate is 5% in year one, 6% in year two, and 7% from year three on. The cost is the total of those monthly savings, paid up front and held in a special account that makes up the difference each month.
2. Permanent Buydowns (Discount Points)
With discount points, you pay to lower your rate for the entire life of the loan. One point equals 1% of the loan amount. It often lowers the rate by around a quarter of a percentage point, but pricing varies by lender and changes daily.
How Does a 2-1 Buydown Work? (Example)
|
$630,000 Loan, 7% Note Rate |
Rate |
Monthly P&I |
|
Year 1 |
5.00% |
$3,382 (saves $809/mo) |
|
Year 2 |
6.00% |
$3,777 (saves $414/mo) |
|
Years 3–30 |
7.00% |
$4,191 |
Total buydown cost: about $14,684, approx. 2.1% of the $700,000 price
For comparison, one discount point on the same loan costs $6,300. If it lowers the rate from 7.00% to 6.75%, you'd save about $105 a month and break even in about 60 months (5 years).
Who Pays for a Rate Buydown?
In today's market, sellers often do. Instead of cutting the price by $15,000, a seller can offer about the same amount as a concession to fund a 2-1 buydown. That can lower the buyer's payment far more in the early years than a price cut would. Loan programs limit how much a seller can contribute:
- Conventional: 3% of the price with less than 10% down, 6% with 10–25% down, and 9% with more than 25% down.
- FHA: up to 6%.
- VA: concessions up to 4% (some costs aren't counted toward that limit).
Important: with a temporary buydown, most lenders still require you to qualify at the full note rate. And if you refinance or sell early, any unused buydown funds are typically applied to your loan balance.
Is a Buydown or a Price Reduction Better?
- A temporary buydown is best if you expect your income to rise or plan to refinance if rates drop.
- Discount points are best if you plan to keep the loan well past the break-even point, usually 5 or more years.
- A price reduction is best if you want lower property taxes and a smaller loan permanently, or if you're worried about the appraisal.
No one can promise that rates will fall, so decide based on what you can afford at the full rate.
How Much Have Massachusetts Home Prices Grown?
| Town | 2011 | 2018 | 2025 | Since 2011 | Since 2018 |
|---|---|---|---|---|---|
| Framingham | $295,000 | $439,950 | $700,000 | +137% | +59% |
| Natick | $387,000 | $600,000 | $982,500 | +154% | +64% |
| Maynard | $298,500 | $380,000 | $622,450 | +109% | +64% |
| Ashland | $344,000 | $460,000 | $761,000 | +121% | +65% |
| Wayland | $555,500 | $764,000 | $1,175,000 | +112% | +54% |
| Hopkinton | $520,000 | $633,500 | $1,010,000 | +94% | +59% |
| Holliston | $377,500 | $460,000 | $725,000 | +92% | +58% |
| Sudbury | $632,500 | $750,000 | $1,152,000 | +82% |
+54% |
| Acton | $520,000 | $635,000 | $943,750 | +81% | +49% |
- Massachusetts home values are up 3.64% over the past year, 34.96% over five years, and 382.57% since 1991. That beats the U.S. figure of 335.69% since 1991.
- Boston metro: up 4.58% over the past year and 418.05% since 1991.
- MetroWest: Framingham's median single family price rose from $295,000 in 2011 to $700,000 in 2025, a gain of about 137%. Natick more than doubled too, from $387,000 to $982,500 (about 154%). Across MetroWest towns like Ashland, Marlborough, Hopkinton and Holliston, prices are up roughly 55% to 65% since 2018 alone
What Did the 2008 Housing Crash Look Like Locally?
Home values did fall during the last downturn, and then they recovered. Braintree's median single family price went from $385,000 in 2005 to $315,000 in 2011, then climbed to $485,000 by 2018. Framingham went from $384,000 to $295,000 to $439,950 over the same years. Long term owners who held on were rewarded, which is why we encourage clients to think in terms of 5–10 years, not 5–10 months.
Frequently Asked Questions
What is the current 30-year mortgage rate?
The average 30 year fixed rate was 7.03% the week of September 24, 2026, according to Freddie Mac. The 15 year fixed averaged 6.42%.
Are mortgage rates high right now historically?
Not by historical standards. Today's rate of about 7% is slightly below the long-run average of about 7.7% since 1971. It feels high because rates were below 3% in 2021.
What is a 2-1 buydown?
A 2-1 buydown is a temporary rate reduction. Your rate is 2 percentage points below the note rate in year one and 1 point below in year two. After that, it returns to the full rate. The cost is paid up front, often by the seller.
How much does it cost to buy down a mortgage rate?
One discount point costs 1% of the loan amount and often lowers the rate by about 0.25%, though pricing varies by lender. A 2-1 buydown on a $630,000 loan at 7% costs about $14,700.
Can the seller pay for a rate buydown?
Yes. Sellers can fund a buydown as a concession, within limits set by your loan program. For conventional loans, the limit is 3–9% of the price, depending on your down payment.
How much have home prices gone up in Massachusetts?
The statewide median single family price rose from $290,000 in 2012 to $638,000 in 2025, an increase of about 120%. The FHFA index shows Massachusetts home values up about 383% since 1991.
This article is for general information only and isn't lending, tax or financial advice. Rates change weekly, and loan terms vary by lender and borrower. Consult a licensed mortgage professional.

Kerri Mulvey
Realtor® | Kerri Mulvey | Moor Realty Group
or another way